

An RO rejection rate calculator estimates how effectively a reverse osmosis membrane reduces dissolved solids between the incoming feed water and the membrane’s product water, called permeate. You need two matched readings: feed-water TDS and membrane-permeate TDS.
The standard formula is:
RO rejection rate (%) = ((Feed TDS − Permeate TDS) / Feed TDS) × 100
For example, if feed water measures 300 ppm and membrane permeate measures 15 ppm, the observed rejection rate is 95%.
That percentage is useful for tracking reverse osmosis membrane performance, but it should not be treated as a complete water-safety result. TDS is an overall conductivity-based indicator. It does not show the rejection of every individual ion, chemical, or uncharged compound.
RO rejection rate calculator
The calculation is:
Observed rejection (%) = (1 − (Permeate ÷ Feed)) × 100
Observed salt passage (%) = 100 − Rejection (%)
The feed and permeate values must use the same measurement type and unit. Do not enter feed TDS in ppm and permeate conductivity in µS/cm unless both readings have first been converted through a consistent method.
Worked RO rejection rate example
Assume that matched samples produce these readings:
-
Feed-water TDS: 300 ppm
-
Membrane-permeate TDS: 15 ppm
First, divide permeate TDS by feed TDS:
15 ÷ 300 = 0.05
Subtract the result from 1:
1 − 0.05 = 0.95
Convert the decimal to a percentage:
0.95 × 100 = 95%
Observed RO rejection rate: 95%
The membrane allowed approximately 5% of the measured dissolved solids to pass into the permeate. This is known as salt passage:
Salt passage (%) = 100 − Rejection (%)
In this example:
100 − 95 = 5%
A single calculation is only a snapshot. The most useful maintenance information comes from comparing measurements collected under similar operating and sampling conditions over time.
|
Result trend |
What to check first |
Practical next action
|
|---|---|---|
|
Rejection is stable and close to the system’s established baseline |
Confirm the samples were collected in the usual way |
Record the date, feed TDS, permeate TDS, and calculated result for future comparison |
|
One reading is unexpectedly low |
Stagnant first-draw water, dirty sample cups, meter inconsistency, or mismatched sampling times |
Flush or operate the system, take fresh matched samples, and repeat the test |
|
Feed TDS changed substantially |
Source-water conditions or a different feed-water sampling point |
Recalculate with a feed sample collected at the same time as the permeate sample |
|
Rejection varies with operating conditions |
Feed pressure, water temperature, demand, or incomplete system stabilization |
Retest under conditions comparable with the previous baseline |
|
Rejection remains lower than the established baseline |
Pretreatment maintenance, scaling, fouling, sealing issues, or membrane wear |
Check the product manual and maintenance history before deciding whether replacement is necessary |
|
Rejection remains near or below roughly 80–85% after repeated valid tests |
Sampling accuracy and all correctable operating and maintenance causes |
Treat the result as a diagnostic warning and evaluate the membrane against model-specific documentation rather than using the range as a universal cutoff |
The last range is not a specification for every RO membrane or Frizzlife system. Membrane type, feed chemistry, pressure, temperature, recovery, and test procedures all affect observed rejection.
Which TDS readings should be used in an RO rejection-rate calculation?

Use a fresh feed-water sample and a fresh membrane-permeate sample collected as close together in time as practical. Both samples should be measured with the same meter, in the same unit, and under stable conditions.
Follow these steps:
-
Identify the correct feed-water sampling point.
The feed sample should represent the water entering the membrane stage. For a practical household check, source water taken from the applicable cold-water supply may be used when it accurately represents membrane feed. If pretreatment changes TDS, sample after that stage instead. -
Operate or flush the RO system before sampling.
Do not rely on water that has been sitting in tubing, a storage tank, or the faucet pathway for an extended period. Stagnant first-draw water can differ from water produced after the system is operating. -
Collect the feed and permeate samples close together.
Feed TDS may change over time. Using yesterday’s tap-water reading with today’s permeate reading can produce a misleading result. -
Use clean, separate sample containers.
Residue from soap, minerals, beverages, or a previous sample can alter a low-TDS permeate reading. -
Rinse the meter probe as directed.
Carryover from the higher-TDS feed sample can noticeably raise a low permeate reading. Follow the meter manufacturer’s cleaning, calibration, and measurement instructions. -
Wait for each reading to stabilize.
Record the stable value rather than the first number displayed. -
Keep units consistent.
If the feed reading is in ppm, the permeate reading must also be in ppm on the same conversion basis. If using conductivity, use the same conductivity unit for both. -
Repeat an unexpected result.
A second matched set of samples is more useful than making a maintenance decision from one unusual reading.
For the most accurate assessment of the membrane itself, measure permeate before water passes through a remineralization stage or another component that can add dissolved ions. A reading taken from the final drinking-water faucet may represent the performance of the complete system rather than the membrane alone.
A conventional carbon post-filter may improve taste and odor without producing a meaningful TDS reduction. Other post-membrane stages can change mineral content. Know the sampling location before attributing the final faucet reading entirely to membrane performance.
Tank-based systems add another complication. Water stored in the tank and post-membrane plumbing can produce a different reading from fresh membrane permeate. If the design does not provide a practical direct-permeate sampling point, use the final faucet reading as a repeatable system-level trend and recognize its limitations.
Never enter zero as feed TDS in the rejection formula because division by zero is undefined. Very low feed TDS also magnifies ordinary meter variation, making the resulting percentage less reliable.
The simple household formula uses an inlet feed reading. More advanced engineering calculations may account for average concentration across a continuously operating membrane system, including the increasing concentration toward the reject side. That level of modeling is generally unnecessary for routine point-of-use maintenance, but it helps explain why a simple TDS calculation may not exactly reproduce a laboratory or engineering specification.
Mixing up rejection rate vs recovery rate: “more product water” can mean faster scaling and lower rejection
RO rejection rate and RO recovery rate measure different things.
Rejection rate is concentration-based:
Rejection = (C_feed − C_permeate) / C_feed
It indicates how much of the measured dissolved-solids concentration does not appear in the permeate.
Recovery rate is flow-based:
Recovery = Q_permeate / Q_feed
Here, Q_permeate is product-water flow and Q_feed is total feed-water flow. In practical system accounting, total feed becomes permeate plus concentrate.
A system could therefore have high rejection but modest recovery, or high recovery and high rejection. The percentages are not interchangeable.
Recovery still matters to membrane operation. As permeate leaves the feed stream, retained salts become more concentrated in the remaining reject water. If a system is pushed beyond its intended recovery, the higher concentration near the membrane surface can increase osmotic pressure and scaling potential. Scaling or adverse operating conditions may then contribute to lower observed rejection and declining production.
That does not mean properly designed high-recovery RO systems automatically have poor rejection. A system can be engineered to balance recovery, crossflow, pressure, membrane area, pretreatment, and concentrate management. The practical maintenance lesson is not to alter flow controls or restrictor components merely to produce more product water. Changes outside the system’s intended design can affect both efficiency and membrane condition.
Keep the distinction simple:
-
Rejection asks: How much dissolved-solids concentration did the membrane reduce?
-
Recovery asks: How much incoming water became product water?
-
Salt passage asks: What percentage of measured dissolved solids appeared in the permeate?
An RO rejection rate calculator answers the first question. It does not calculate water efficiency unless feed and product flow measurements are also supplied.
Maintain Your RO System—or Explore an Upgrade
If repeated rejection-rate tests show a persistent decline, first check maintenance needs and model-specific guidance. If your current system no longer fits your household's needs, you can also compare newer RO system options.
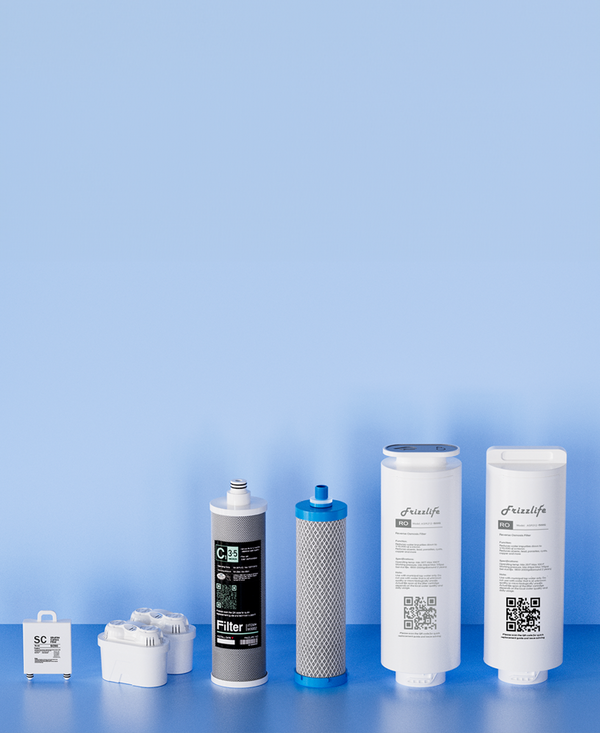
Find the Right Replacement Filter
A declining rejection trend does not always mean the entire RO system needs replacement. Check whether scheduled filter or membrane maintenance is due first.
- Browse filters by Frizzlife system
- Check model compatibility before ordering
- Useful when troubleshooting ongoing performance changes
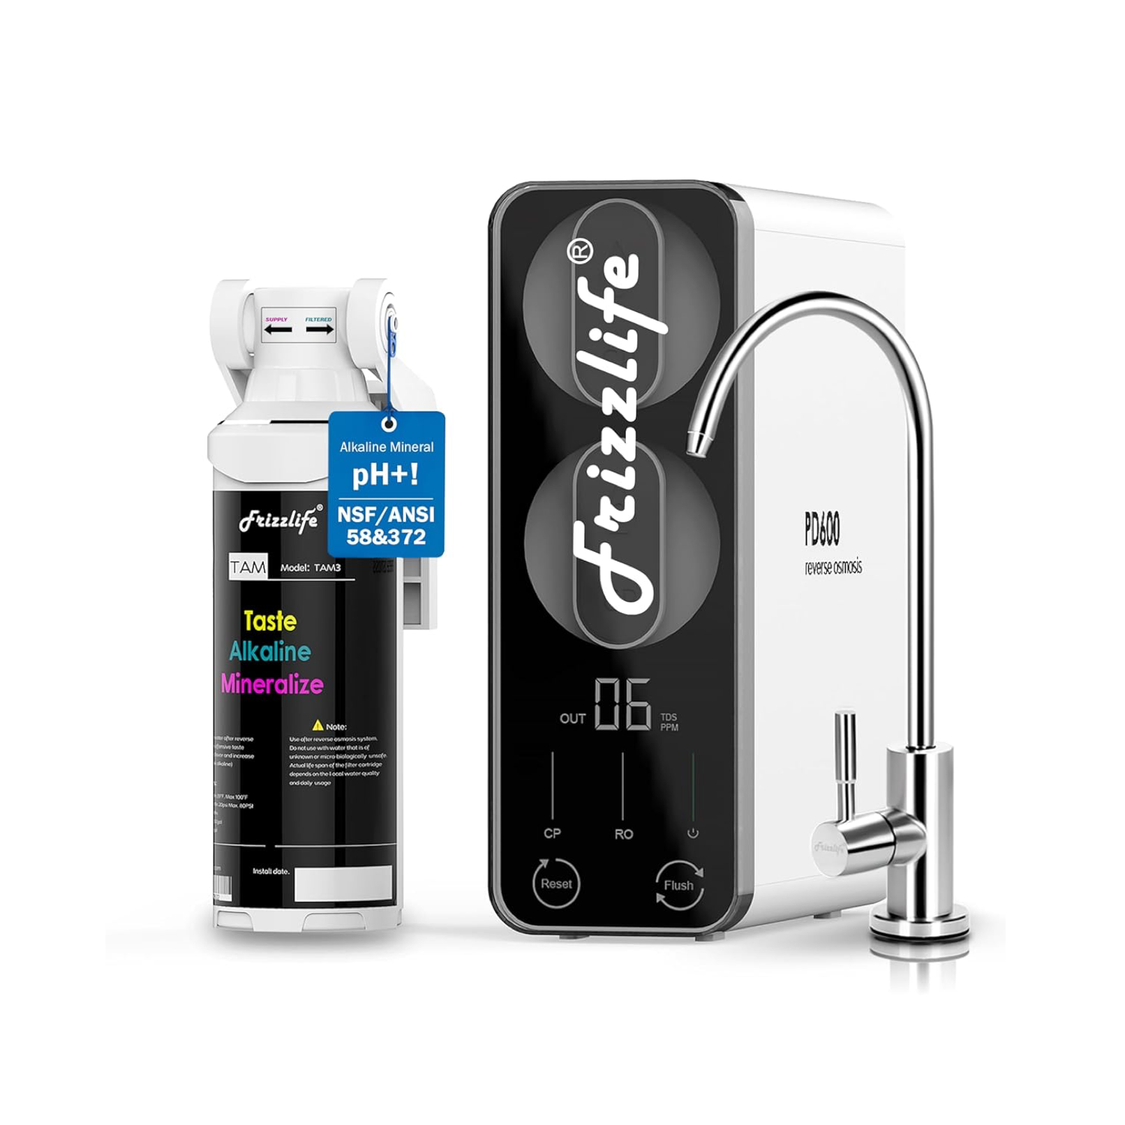
Frizzlife PD600-TAM3
A tankless under-sink RO option with fast water delivery, alkaline remineralization and built-in TDS monitoring for users considering a system upgrade.
- 600 GPD rated capacity
- Real-time TDS display
- Alkaline remineralization stage
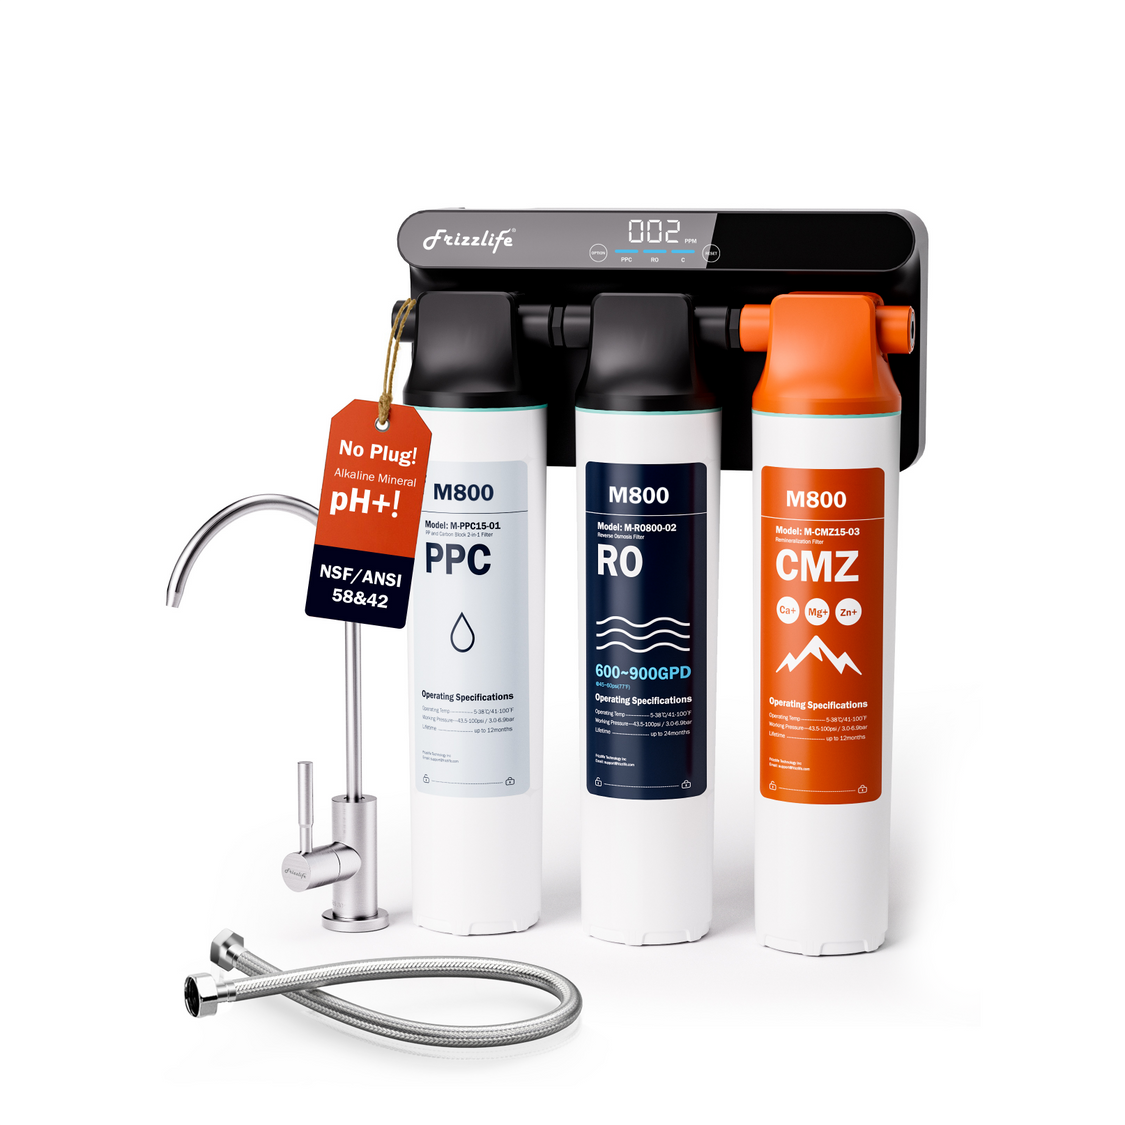
Frizzlife M800
A high-capacity tankless RO option designed for users who prefer an under-sink system that operates without a conventional electrical connection.
- 900 GPD rated capacity
- Non-electric tankless design
- Alkaline remineralization
When to replace the RO membrane: interpreting sustained rejection below ~80–85% vs correctable causes

A single low calculation does not establish that an RO membrane needs replacement. Replacement becomes more reasonable when rejection remains substantially below the membrane’s previous baseline after proper sampling, system stabilization, and correction of operating or maintenance issues.
A sustained result around or below 80–85% is sometimes used as a diagnostic warning in residential troubleshooting. It should not be treated as a universal replacement specification. Some systems, membranes, feed waters, and operating conditions have different expectations. Always compare the result with model documentation when available.
For example, consider a system with feed water at 250 ppm:
-
At 10 ppm permeate, rejection is 96%.
-
At 25 ppm permeate, rejection is 90%.
-
At 50 ppm permeate, rejection is 80%.
If the 50 ppm result persists across correctly collected samples while feed water and operating conditions remain comparable, the change warrants deeper evaluation. If the result returns to the earlier range after flushing, correcting a sampling error, or completing overdue maintenance, immediate membrane replacement may not be necessary.
When repeated testing points to an exhausted or deteriorated filter stage, review the system manual and find the appropriate component among Frizzlife replacement filters. Verify model compatibility before ordering because filter and membrane requirements are system-specific.
RO membrane rejection percentage should be one factor in the decision—not the only one. Also consider the maintenance record, product-water quality trend, abnormal taste or odor, system output, visible leakage, and model-specific instructions. Taste alone cannot diagnose membrane rejection, and a TDS reading alone cannot identify individual contaminants.
What is a good rejection rate for a home RO system?
In common residential use, an observed TDS rejection rate of 90% or higher is often viewed as useful real-world context for a functioning RO membrane. Values in the 95–99% range are frequently associated with membrane ratings or controlled salt-test conditions.
These numbers are not universal Frizzlife specifications, and a laboratory rating should not be assumed to predict every household measurement. Actual reverse osmosis rejection rate calculator results depend on:
-
Membrane type and condition
-
Feed-water chemistry
-
Which ions and dissolved substances are present
-
Feed pressure
-
Water temperature
-
System recovery
-
Pretreatment condition
-
Sampling point
-
Meter accuracy and conversion method
-
Whether the system was stable before testing
A result of 92%, for example, could be normal for one system under its actual operating conditions but lower than expected for another. The stronger comparison is usually the membrane’s model-specific documentation combined with its own correctly measured historical baseline.
Suppose an RO system repeatedly produces these results under comparable conditions:
|
Test date |
Feed TDS |
Permeate TDS |
Observed rejection
|
|---|---|---|---|
|
Baseline |
300 ppm |
12 ppm |
96% |
|
Later test |
315 ppm |
16 ppm |
94.9% |
|
Most recent test |
305 ppm |
34 ppm |
88.9% |
The small difference between the first two tests may reflect ordinary variation in source water, operating conditions, or measurement. The third result represents a clearer trend that deserves retesting and troubleshooting.
This trend-based approach is more informative than judging all home RO systems against one fixed percentage.
Why observed rejection may differ from a rated specification
Published membrane performance is commonly determined under defined test conditions. Household conditions rarely duplicate every part of that test, including feed composition, pressure, temperature, recovery, and system stabilization.
An inexpensive handheld TDS meter also estimates dissolved ionic content from conductivity. It does not reproduce laboratory analysis. Two meters can report somewhat different TDS values because of calibration, temperature compensation, probe condition, or the conversion factor used to translate conductivity into estimated ppm.
For these reasons, call the calculator result observed TDS rejection. It is a practical maintenance metric, not a normalized laboratory rating.
Industrial operators may normalize membrane performance to account for changing pressure, temperature, concentration, and flow. A household user generally does not have enough instrumentation for that calculation. Consistent sampling under similar conditions is the practical alternative.
Does high TDS rejection prove that the water is safe?
No. High TDS rejection indicates a large reduction in measured dissolved ionic content. It does not prove that every possible contaminant was removed, and it is not a substitute for contaminant-specific testing.
Different dissolved substances have different rejection behavior. Some ions are rejected more effectively than others, while certain uncharged or low-conductivity compounds may not be reflected well by a TDS meter. A 95% TDS rejection result therefore does not mean that every substance was reduced by 95%.
Use TDS-based rejection to monitor general membrane behavior. Use appropriate laboratory testing and applicable certified performance information when a specific contaminant or drinking-water concern must be evaluated.
Why is my RO rejection rate dropping over time?
A falling RO rejection rate may reflect a real change in the membrane, but measurement and operating differences should be investigated first. Check the simplest and most reversible causes before concluding that the membrane has worn out.
Start by comparing complete test records rather than permeate TDS alone. If feed TDS increases from 200 to 400 ppm, permeate TDS can increase even when the rejection percentage remains the same.
At 95% rejection:
-
200 ppm feed produces approximately 10 ppm permeate.
-
400 ppm feed produces approximately 20 ppm permeate.
The permeate reading doubled, but the calculated rejection did not change. That is why every maintenance test needs a current feed reading.
What can cause an RO membrane to show a low rejection rate?
Low observed rejection generally falls into four categories: measurement error, operating conditions, maintenance issues, and sustained membrane deterioration.
Measurement and sampling errors
Common problems include:
-
Comparing samples collected on different days
-
Using a stagnant first-draw permeate sample
-
Testing stored tank water as though it were direct membrane permeate
-
Sampling after a remineralization stage
-
Contaminating the permeate sample with residue from the feed sample
-
Mixing ppm and conductivity readings
-
Using different meters or TDS conversion scales
-
Recording a reading before the meter stabilizes
-
Testing with an unclean, damaged, or poorly calibrated probe
Repeat the calculation with a matched sample pair before taking corrective action.
Changing operating conditions
Membrane performance can shift with:
-
Lower or unstable feed pressure
-
Changes in water temperature
-
Increased feed-water salinity
-
A different feed composition
-
Changes to concentrate flow or recovery
-
Testing during startup or before conditions stabilize
Temperature and pressure can affect membrane flow and observed separation. A winter test and a summer test may not be directly comparable if source-water temperature changes substantially. Similarly, a system tested during unusual household demand may behave differently from one tested under steady conditions.
Maintenance and system issues
A low result can also be associated with:
-
Overdue sediment or carbon pretreatment
-
Fouling at the membrane surface
-
Mineral scaling
-
Improper membrane seating
-
A damaged seal or bypass path
-
Incorrectly installed replacement components
-
Post-membrane mixing that changes the faucet sample
-
A post-filter or remineralization stage influencing final-water TDS
If the final faucet reading changes but direct permeate rejection remains stable, inspect the post-membrane stages rather than assuming membrane failure. Model-compatible RO post-filter replacements may be relevant when an installed post-filter is due for service or is implicated by system-level troubleshooting.
Sustained membrane deterioration
Membranes do not maintain identical performance indefinitely. Chemical exposure, persistent fouling, scaling, physical damage, and normal wear can eventually increase salt passage. The key sign is not merely a high permeate TDS number but a repeated decline in calculated rejection under comparable conditions.
Consider membrane deterioration more likely when:
-
Matched testing repeatedly confirms the low result.
-
Feed TDS has been measured rather than assumed.
-
The system has been allowed to stabilize.
-
Pretreatment and post-treatment issues have been addressed.
-
Pressure and temperature differences do not explain the change.
-
The membrane is correctly installed and sealed.
-
Rejection remains materially below its earlier baseline or model-specific expectation.
When the system has broader problems—such as repeated maintenance issues, unsuitable capacity, or performance that no longer fits household needs—it may be appropriate to evaluate a complete reverse osmosis filter system. Compare model documentation and intended operating conditions rather than choosing solely by a generic rejection percentage.
How often should RO rejection rate be checked?
There is no single testing interval appropriate for every system. A practical approach is to establish a baseline when the system and membrane are operating normally, then retest:
-
When permeate TDS changes noticeably
-
After membrane or filter service
-
After a major change in feed-water conditions
-
When product-water performance appears abnormal
-
When the system manual calls for a performance check
-
Before deciding that a membrane needs replacement
Keep a simple maintenance record containing:
-
Test date
-
Feed TDS
-
Permeate TDS
-
Calculated rejection
-
Sampling location
-
Water temperature, if available
-
Relevant filter or membrane service
-
Unusual pressure or source-water conditions
Consistent records make gradual changes easier to distinguish from meter noise or one-time sampling errors.
Final calculation checklist
For a reliable RO membrane rejection percentage:
-
Collect fresh feed and membrane-permeate samples close together.
-
Avoid stagnant first-draw water.
-
Confirm that the permeate sample has not passed through a stage that adds dissolved minerals.
-
Use the same clean meter and the same unit for both samples.
-
Calculate:
(1 − (Permeate TDS / Feed TDS)) × 100
-
Record the result as observed TDS rejection.
-
Compare it with previous valid tests and model-specific documentation.
-
Retest an unexpected result before replacing components.
An RO rejection rate calculator is most valuable as a trend-monitoring tool. Correctly matched samples can reveal declining membrane performance, while repeated tests help separate genuine deterioration from changes in feed water, sampling, pressure, temperature, or maintenance conditions.
References
https://wqa.org/wp-content/uploads/2022/09/Article-4-POU-RO-Performance-and-Sizing.pdf